1995
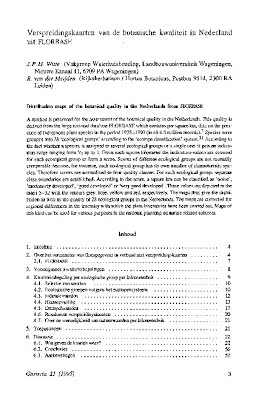
Verspreidingskaarten van de botanische kwaliteit in Nederland uit FLORBASE
Publication
Publication
Distribution maps of the botanical quality in the Netherlands from FLORBASE
Gorteria: tijdschrift voor de floristiek, de plantenoecologie en het vegetatie-onderzoek van Nederland , Volume 21 - Issue 1/2 p. 3- 59
A method is presented for the assessment of the botanical quality in the Netherlands. This quality is derived from the large national database FLORBASE which contains per square km, data on the presence of indigenous plant species in the period 1975-1990 (in all 4.5 million records). 7 Species were grouped into 28 ‘ecological groups’ according to the ‘ecotope classification’ system. 21 According to the fact whether a species is assigned to several ecological groups or a single one, it gets an indication-value ranging from 1/3 up to 1. From each square kilometer the indication-values are counted for each ecological group to form a score. Scores of different ecological groups are not mutually comparable because, for instance, each ecological group has its own number of characteristic species. Therefore scores are normalized to four quality classes. For each ecological group, separate class boundaries are established. According to the score, a square km can be classified as ‘noise’, ‘moderately developed’, ‘good developed’ or ‘very good developed’. These values are depicted in the maps 5—32 with the colours grey, blue, yellow and red, respectively. The maps thus give the distribution as well as the quality of 28 ecological groups in the Netherlands. The maps are corrected for regional differences in the intensity with which the plant inventories have been carried out. Maps of this kind can be used for various purposes in the national planning on nature related subjects.
| Additional Metadata | |
|---|---|
| Gorteria: tijdschrift voor de floristiek, de plantenoecologie en het vegetatie-onderzoek van Nederland | |
| Released under the CC-BY 4.0 ("Attribution") License | |
| Organisation | Naturalis journals & series |
|
Witte, F.& van der Meijden, R. (1995). Verspreidingskaarten van de botanische kwaliteit in Nederland uit FLORBASE. Gorteria: Tijdschrift Voor De Floristiek, De Plantenoecologie En Het Vegetatie-onderzoek Van Nederland, 21(1/2), 3–59. |
|